A kitchen fire has closed a Manchester restaurant. The owner can see the physical damage, but the financial damage feels shapeless: cancelled bookings, continuing rent, staff costs, delayed reopening, and customers who may not return immediately. Then the loss adjuster asks for a turnover baseline, a gross profit rate, and a calculation of saved expenses. The owner knows the business, but has never had to reconstruct the result it would have achieved if the fire had not happened.
That is where business interruption work becomes more than a subtraction exercise. A defensible claim must identify the insured cause, define the correct indemnity period, rebuild normal trading from reliable records, apply trends and seasonality, and distinguish costs that stopped from costs that continued. The same discipline applies when an SME suffers a covered property loss, a supply-chain interruption, or an operational event affecting only part of its activity.
The UK Supreme Court's business interruption test case also showed why policy wording matters. The judgment affected how certain disease, prevention-of-access, trends, and causation issues were considered in disputed claims, while FCA claims data later recorded more than £1.5 billion paid to over 36,000 small businesses following the test case, as reported by the FCA's business interruption claims dataset. Financial uncertainty during an interruption often reflects a wider need for disciplined gestione del rischio finanziario, not a missing spreadsheet.
When a Disaster Hits and the Numbers Won't Add Up
The Manchester operator opens the restaurant again, but reopening doesn't restore the old trading pattern overnight. The kitchen may function, yet the business still carries repair-related disruption, reduced capacity, lost bookings, supplier complications, and uncertainty about the weeks ahead. The owner's instinct is understandable: total the cancelled sales and add every bill paid during closure.
That approach usually creates trouble. A BI policy doesn't normally insure lost sales as a standalone figure. It measures the financial consequence through the policy's defined gross profit mechanism, then considers increased costs of working and relevant savings. A claim can therefore be overstated by including sales that would never have materialised, or understated by ignoring continuing expenses and the time needed to recover trading.
The gap between panic and proof
On a live mandate, the first task isn't to produce a polished total. It's to stabilise the evidence. I would establish the event date, affected operations, trading restrictions, repair milestones, available capacity, and the records that existed before the incident. That creates a factual timeline before assumptions begin to influence the calculation.
The same problem appears outside a traditional fire or flood. UK businesses reported 8.8 million internet failures and 50.5 million hours of disruption in 2023, with an estimated cost of £3.7 billion, according to Beaming's UK internet failure analysis. For an SME, a digital interruption may affect online orders, payment processing, warehouse instructions, customer service, or one essential production system without producing a clean shutdown date.
Practical rule: Define the operational impact before you calculate the financial impact.
What the calculation must resolve
A well-prepared claim answers four questions in sequence:
- What caused the loss? The policy trigger and causation analysis determine whether the financial loss falls within cover.
- What would normal trading have looked like? The accountant reconstructs standard turnover using historic results, trends, seasonality, contracts, and known business circumstances.
- How long did the interruption affect results? The indemnity period sets the temporal boundary.
- Which costs changed because of the interruption? Saved variable costs reduce the claim, while justified increased costs may support recovery.
The result should be reproducible. An insurer, loss adjuster, mediator, or court should be able to trace each figure back to a ledger, VAT return, EPOS report, payroll record, contract, operational document, or clearly documented assumption.
Pin Down the Proximate Cause and Indemnity Period
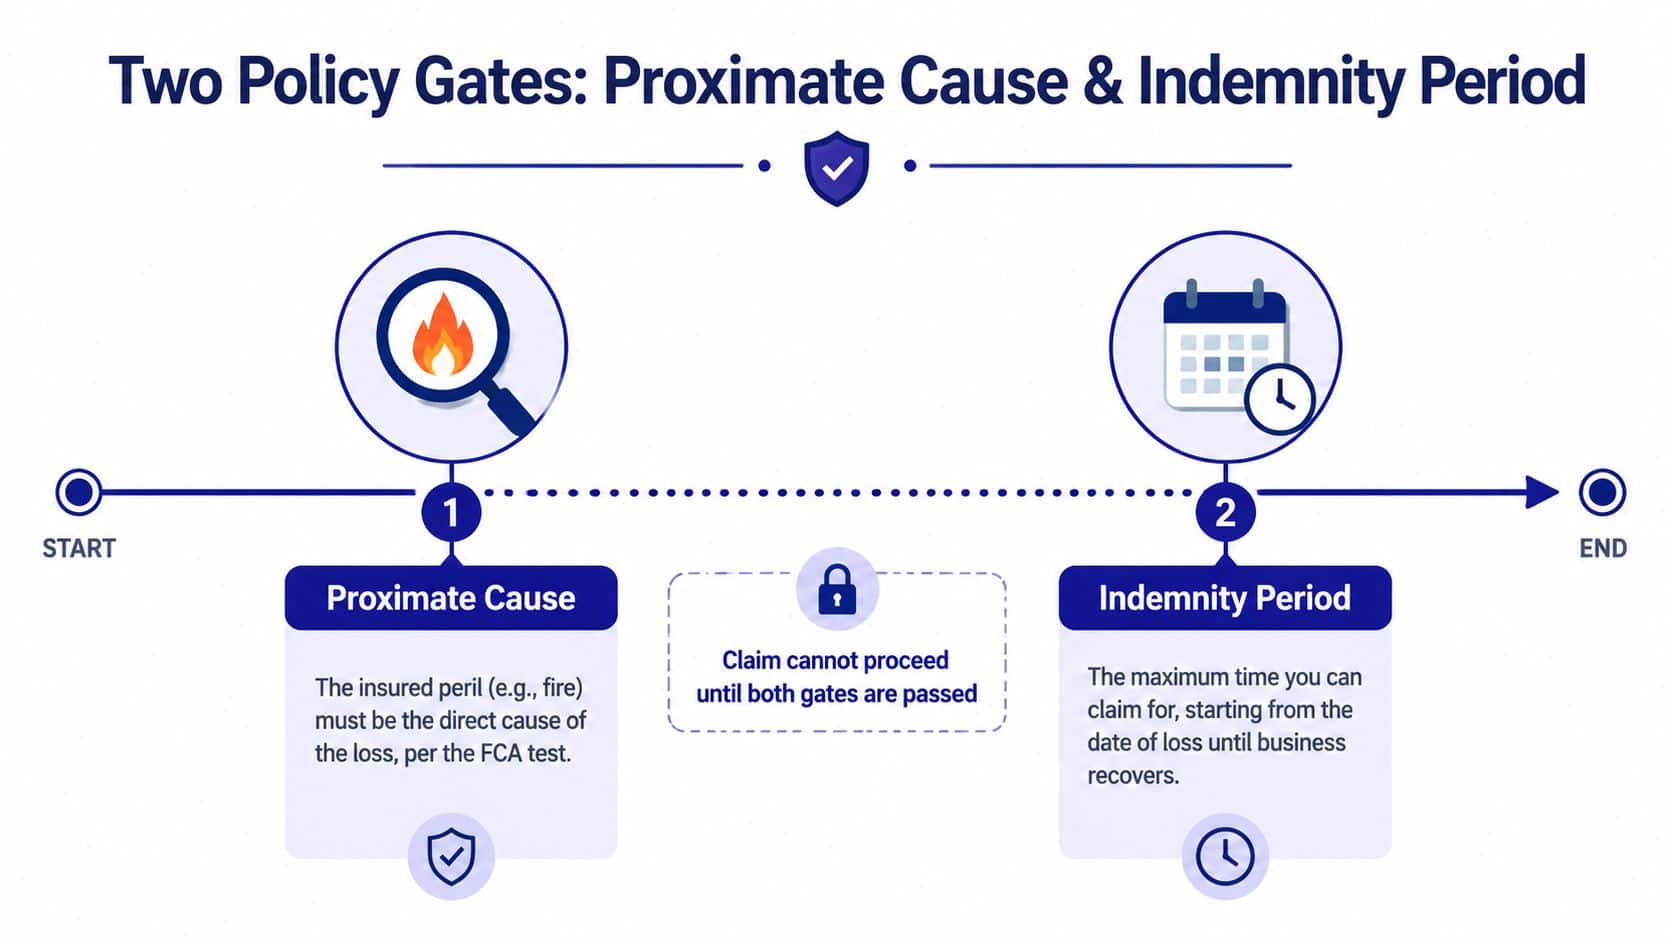
Every UK BI claim faces two policy gates before quantum becomes meaningful. The first concerns proximate cause, meaning the insured peril that caused the interruption. The second concerns the indemnity period, which defines how long the policy responds to results affected by that event.
Gate one, identify the insured peril
Start with the policy schedule, insuring clause, extensions, exclusions, and relevant definitions. Then map the event chronology to the wording. A fire that damages a kitchen, for example, may provide a straightforward causal route to a restaurant's closure. A supply failure, utility interruption, cyber event, or partial restriction may require closer analysis of extensions and any physical damage requirement.
The FCA test case culminated in the Supreme Court judgment on 15 January 2021. The FCA stated that the judgment confirmed that cover might be available for partial closure as well as full closure, that mandatory closure orders didn't need to be legally binding to trigger cover in relevant circumstances, and that claims shouldn't be reduced because the same loss would have happened anyway because of the pandemic. The FCA's summary of the Supreme Court judgment provides the UK context for those causation and policy-trigger issues.
A causation argument can derail an otherwise careful SME claim. Don't assume that a visible disruption automatically establishes cover, and don't concede that a mixed cause defeats the claim without testing the wording and the factual sequence.
Gate two, define the recoverable window
The indemnity period starts with the insured event and ends no later than the maximum indemnity period stated in the policy. It generally ends when the business has recovered, or should have recovered, to the level it would have achieved had the insured event not occurred, subject to the wording and policy limit. It isn't merely the number of days the premises remained closed.
Take a flood-damaged retailer. If it reaches the counterfactual trading level in week 14, the claim period may stop there. If the premises reopen quickly but customer traffic and stock availability don't return to the counterfactual level until week 38, the financial impact may extend much further, subject to the maximum period and other terms.
The policy wording controls. UK guidance and calculator-based benchmarks commonly refer to 12, 18, 24, or 36 months, because some businesses need more than a year to recover fully, as reflected in the UK Supreme Court press summary. A short maximum period can cap recovery even when the business hasn't fully normalised.
The following video offers additional background on the two policy gates and the practical boundary between coverage analysis and quantification.
Build the Historic Baseline and Choose Your Loss Basis
A sound calculation starts with the business before the incident, not with the first month of lost sales. Assemble the records that show how the business traded, then test whether those records reflect sustainable performance.
Useful evidence often includes:
- Management accounts: Monthly profit and loss reports reveal turnover patterns, margins, exceptional items, and cost behaviour.
- VAT returns: These provide an independent cross-check against reported taxable sales.
- EPOS and booking data: Transaction-level records can expose customer volumes, average transaction values, cancellations, and seasonal peaks.
- Statutory accounts: Prior-year accounts help reconcile management reporting and identify accounting policy changes.
- Operational records: Production logs, delivery schedules, contracts, staffing rotas, and capacity data help connect financial results to trading capability.
Select the policy-defined basis
Don't default to accounting gross profit. UK wordings commonly define gross profit through turnover, stock and work in progress movements, less opening stock and work in progress and specified uninsured working expenses. The Allianz UK business interruption wording illustrates why the policy formula can differ from ordinary accounts.
| Loss Basis | Policy Definition | Required Inputs | Typical Add-Backs |
|---|---|---|---|
| Turnover | Lost turnover measured against the policy comparator | Monthly sales, EPOS, invoices, VAT records | Usually requires separate treatment of variable costs |
| Gross profit | Policy-defined gross profit applied to the turnover shortfall | Turnover, stock, work in progress, uninsured working expenses | Specified working expenses excluded by the wording |
| Gross earnings | Earnings measure defined by the individual wording | Revenue, payroll, operating expense schedules | Costs identified as continuing or excluded |
| Gross revenue fees | Revenue or fees adjusted under a professional-services wording | Fee income, work records, contracts, recoverability data | Wording-specific deductions and working expenses |
Payroll illustrates the danger. A business may treat wages as an operating expense in its accounts, while the policy may treat some payroll costs differently for insurable gross profit purposes. Stock variations, depreciation, furlough top-ups, and one-off contracts can also distort the pre-incident figures.
Normalise before projecting
A forensic accountant tests whether the historic period represents normal trading. A single unusually large contract may inflate turnover without creating a repeatable trend. A post-pandemic rebound may make the immediate prior year unrepresentative. A temporary staffing shortage may suppress output even though demand remained strong.
For a practical explanation of the accounting records management teams use, see this guide to management accounts and their definition. The point isn't to make the baseline look more favourable. It's to make it reflect the trading result the business could reasonably have achieved, supported by contemporaneous evidence.
Project the Counterfactual Using Trends and Seasonality
The counterfactual is the financial result the business would have achieved but for the insured peril. A simple prior-year comparison often fails because it treats every month as interchangeable and ignores changes already visible before the loss.
Begin with the pre-loss trend. Review monthly management accounts, sales pipelines, signed contracts, customer retention, pricing changes, capacity, and credible forecasts. Apply the identified trend consistently to the relevant turnover and gross profit lines, rather than increasing sales while leaving the margin unsupported.
Build the projection month by month
Seasonality comes next. Easter can move between reporting months. Black Friday can shift retail demand. A B2B business may recognise a large contract around an anniversary or renewal cycle. A manufacturer may have planned maintenance, customer shutdowns, or production peaks that make a flat monthly average misleading.
A working model might look like this:
| Month | Prior Year Turnover | Trend Factor | Seasonality Factor | Counterfactual Turnover |
|---|---|---|---|---|
| January | Prior-year monthly result | Evidence-based adjustment | Month-specific pattern | Prior year adjusted for both factors |
| February | Prior-year monthly result | Evidence-based adjustment | Month-specific pattern | Prior year adjusted for both factors |
| March | Prior-year monthly result | Evidence-based adjustment | Month-specific pattern | Prior year adjusted for both factors |
The table deliberately shows the structure rather than an invented numerical outcome. The actual factors must come from the business records and the policy approach.
The UK Supreme Court confirmed that many BI wordings use trends clauses to adjust prior-year results for circumstances affecting the business, so the estimate reflects what would have happened absent the insured peril. In practice, document the trend evidence available immediately before the incident. Don't use later performance alone to rationalise an optimistic projection.
Reconcile and preserve the audit trail
Compare the unadjusted prior-year model with management forecasts prepared before the event. Investigate every material variance. A forecast supported by signed orders, recruitment plans, pricing announcements, or board papers carries more weight than a forecast created after the loss.
The analysis should also test downside and upside sensitivities. A transparent report can show how the claim changes if a disputed trend, contract, or seasonal assumption is accepted or rejected. The counterfactual analysis methodology provides a useful framework for separating evidence from assumption.
Calculate Avoidable Costs, Unavoidable Costs, and Increased Cost of Working
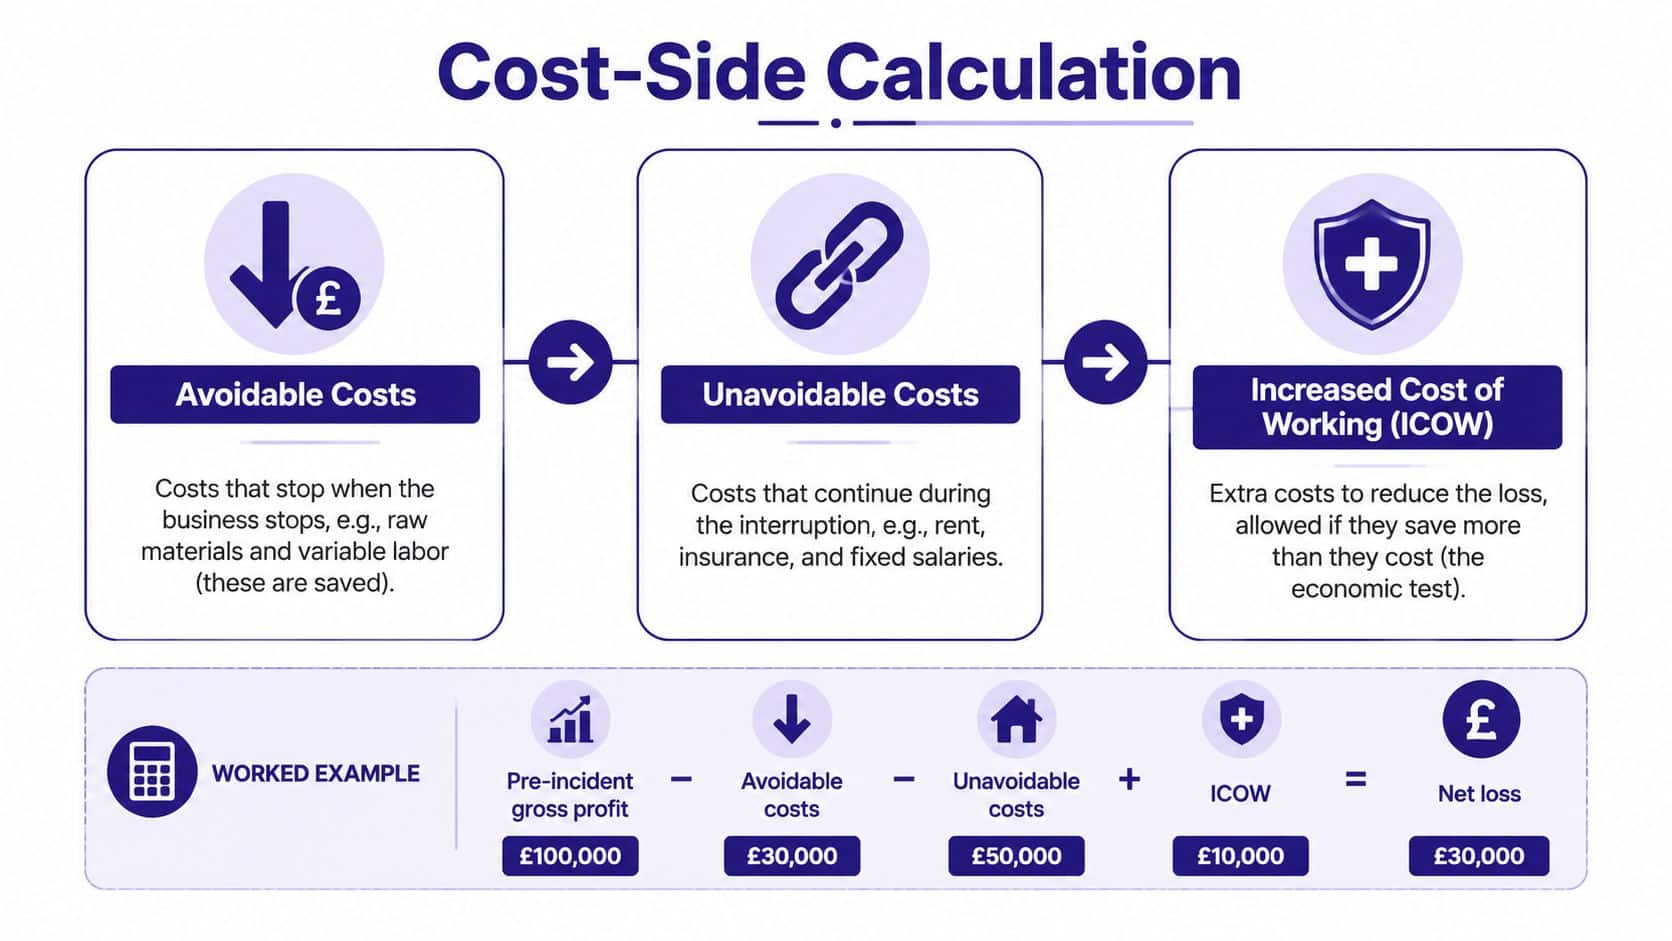
The cost side decides whether a turnover shortfall represents a recoverable gross profit loss. Under standard UK BI wording, the core calculation applies the policy's Rate of Gross Profit to the reduction between Standard Turnover and actual Turnover during the indemnity period, then deducts charges and expenses saved because of the interruption. The CII business interruption policy wording update sets out that standard mechanism.
Consider a UK manufacturer whose plant stops operating after an insured event. Raw materials and some production labour may fall away, creating savings. Rent, insurance, business rates, equipment finance, and certain salaried roles may continue. The manufacturer may also pay emergency freight to fulfil urgent customer orders and protect relationships.
Classify each cost by behaviour
- Avoidable costs: These stop or reduce because production stops. Raw materials, transaction charges, and variable labour often require careful testing rather than automatic deduction.
- Unavoidable costs: These continue despite the interruption. Rent, insurance, business rates, and some fixed salaries may remain payable.
- Increased cost of working: These are additional expenses incurred to reduce the insured loss, such as alternative production, emergency freight, temporary premises, or expedited repairs.
The classification must follow the policy and the facts. A payroll cost isn't automatically avoidable because production stopped. Standby payments, minimum-hours obligations, retention payments, and continuing employment arrangements can produce a different answer.
Apply the ICOW economic test
An increased cost is not recoverable merely because it helped the business. The expenditure should reduce the loss, and the economic benefit should justify the cost under the wording. If emergency freight costs more than the gross profit loss it prevents, the insurer may challenge the excess or the whole item depending on the policy.
Keep the evidence practical:
- Map cost codes: Link the general ledger to policy categories and identify changes from the pre-loss period.
- Reconcile payroll: Separate normal wages, standby payments, redundancy, furlough treatment, and employer contributions.
- Retain supplier invoices: Match emergency freight, temporary facilities, overtime, and expedited services to the lost activity they addressed.
- Record the decision: Explain why management incurred the cost, what alternative existed, and how the expenditure reduced interruption.
Operational resilience records can strengthen the explanation of disruption and recovery decisions. For example, a maintenance team assessing equipment dependency may find this mean time between failure explained resource useful when documenting reliability and replacement assumptions.
Furlough payments and HMRC contributions need careful policy treatment and factual reconciliation. Don't deduct or claim them by instinct. Trace the amounts, establish what costs they offset, and apply the wording and relevant FCA guidance to the actual calculation.
Why UK Businesses Get Better Results with a Forensic Accountant
Many SME directors hesitate to instruct an accountant because they expect another professional fee, a slower claim, or a more confrontational relationship with the loss adjuster. Those objections make sense, particularly while cash flow is under pressure. They also overlook the cost of submitting a weak calculation that cannot survive questions about the baseline, policy gross profit, mitigation, or causation.
A forensic accountant doesn't replace the business owner's operational knowledge. The accountant turns that knowledge into a documented financial model, tests it against source records, and identifies where the policy wording changes the result.
The value lies in the disputed assumptions
A policyholder-prepared spreadsheet may list lost sales and continuing expenses, but it often leaves the difficult issues unexplained. A forensic mandate should address:
- Evidence assembly: Pull together management accounts, VAT returns, EPOS data, payroll, contracts, invoices, and operational records.
- Trend analysis: Distinguish a genuine pre-loss trajectory from a post-event explanation.
- Policy definitions: Reconcile accounting profit with the policy's insurable gross profit or other selected basis.
- Cost behaviour: Demonstrate which expenses saved, which continued, and which increased costs passed the economic test.
- Negotiation support: Give the broker, adjuster, insurer, solicitor, mediator, or court a clear route through the figures.
The best working relationship with a loss adjuster isn't based on aggression. It comes from presenting a calculation that shows the assumptions, acknowledges uncertainty, and answers foreseeable challenges before they become formal disputes.
A low-friction starting point
Lighthouse Consultants' London forensic accounting team works on quantifying and supporting BI claims involving property, supply-chain, and cyber-related events. Its business interruption claims service focuses on policy coverage analysis, financial reconstruction, and quantum assessment, with a fixed-fee discovery call available as an initial way for an SME or adviser to scope the mandate.
That format can help a director decide what assistance is needed. Some claims require a full expert report. Others need a baseline review, a targeted cost analysis, or an independent challenge to an insurer's calculation. The sensible choice depends on the dispute, the records, the policy complexity, and the value at risk.
Defensible Reports and Your Next Step with Lighthouse Consultants
A reliable BI calculation follows a controlled sequence. Confirm the insured peril and causal link, define the indemnity period, select the policy loss basis, rebuild the historic baseline, normalise anomalies, project counterfactual turnover, measure actual trading, calculate the policy gross profit rate, deduct saved costs, and test increased costs of working.
The recurring failures are equally clear. Businesses use the wrong comparator, align the model to the premises closure rather than the financial recovery period, apply an unsupported trend, overlook seasonality, accept an anomalous prior year, or claim ICOW without demonstrating the economic benefit. Each error gives the insurer a reason to reduce or delay the claim.
Make the report auditable
A defensible report should contain:
- Contemporaneous support: Identify the document behind each material assumption.
- A clear calculation trail: Show the bridge from standard turnover to actual turnover, policy gross profit, saved costs, and increased costs.
- Sensitivity analysis: Explain how disputed assumptions affect the outcome.
- Operational context: Connect the financial result to capacity, repairs, supply, staffing, customers, and recovery.
- Policy alignment: State where the wording governs the treatment of each item.
That standard matters whether the submission goes to an insurer or loss adjuster, enters a negotiation, or becomes evidence in formal proceedings. Clear analysis doesn't guarantee agreement, but it gives decision-makers something concrete to test.
Lighthouse Consultants can help businesses and their advisers reconstruct the loss, assess policy definitions, quantify the claim, and prepare evidence for insurers, loss adjusters, or courts. Book a discovery call when the figures no longer reconcile, the indemnity period is disputed, or the insurer's calculation doesn't reflect the way the business operated.
Lighthouse Consultants offers forensic accounting, policy-focused BI analysis, and independent loss quantification for UK businesses dealing with interruption claims. Visit Lighthouse Consultants to discuss your records, policy position, and the next practical step for building a defensible submission.